In the alphabet soup of financial metrics, few are as obscure—or as revealing—as Embedded Value (EV). While equity investors worldwide obsess over PER and PBR, a handful of listed Japanese life insurers are quietly trading at 60 to 70 cents on the yen of their intrinsic worth, measured by a yardstick that almost nobody outside the insurance sector bothers to learn.
That is about to matter.
Japan’s interest-rate regime is shifting. Its population is ageing into a demographic structure that demands more, not less, private insurance. And the regulatory apparatus that suppressed insurer profitability for two decades is now, paradoxically, creating the conditions for outsized returns. Understanding why requires a detour through the peculiar economics of life insurance—and a valuation framework that most retail investors have never encountered.
What Embedded Value actually is
Forget everything you know about valuing companies. Life insurers break the standard toolkit. A bank’s book value approximates its liquidation value. A manufacturer’s earnings reflect its current productivity. But a life insurer’s accounting profits are, by design, misleading. When a company writes a profitable new policy, its reported profit falls—because upfront acquisition costs (commissions, medical underwriting, systems) hit the income statement immediately, while the premium income trickles in over 20, 30, sometimes 50 years.
This is not a flaw. It is the nature of the business. But it means that PER and PBR, applied naively, penalise the most successful insurers—the ones writing the most new business.
Embedded Value was invented to solve this problem. It asks a simple question: what is the company worth to shareholders right now, accounting for all future profits already locked in?
The answer has two components: Adjusted Net Worth (ANW), which represents what the company has already accumulated, and the Value of In-Force Business (VIF), which captures the present value of future profits from policies already on the books. Together, EV = ANW + VIF.
| Component | What it captures | Key drivers |
|---|---|---|
| Adjusted Net Worth (ANW) / 修正純資産 | What the company has already accumulated: net assets, unrealised gains on securities, subordinated debt, off-balance-sheet reserves | Market valuations, realised gains from strategic shareholding sales, retained earnings |
| Value of In-Force Business (VIF) / 保有契約価値 | Present value of all future after-tax profits expected from policies already on the books | Interest rates (both the earned spread and the discount rate), mortality experience, lapse rates, expense efficiency |
| EV = ANW + VIF | Total shareholder value embedded in the enterprise | Macro environment (rates, markets) + micro business quality (underwriting, product mix, distribution) |
The crucial insight: VIF is forward-looking. It contains the present value of profits that will materialise over the next several decades from contracts the insurer has already signed. New business adds to VIF each year. Rate changes alter VIF mechanically. This is not speculation about future sales—it is the discounted arithmetic of existing obligations.
How Japanese life insurers actually make money
Before assessing whether EV will grow, one must understand where profits originate. Japanese insurers decompose earnings into three sources—a framework mandated by the FSA and embedded in supervisory reporting. No equivalent exists in the United States or Europe.
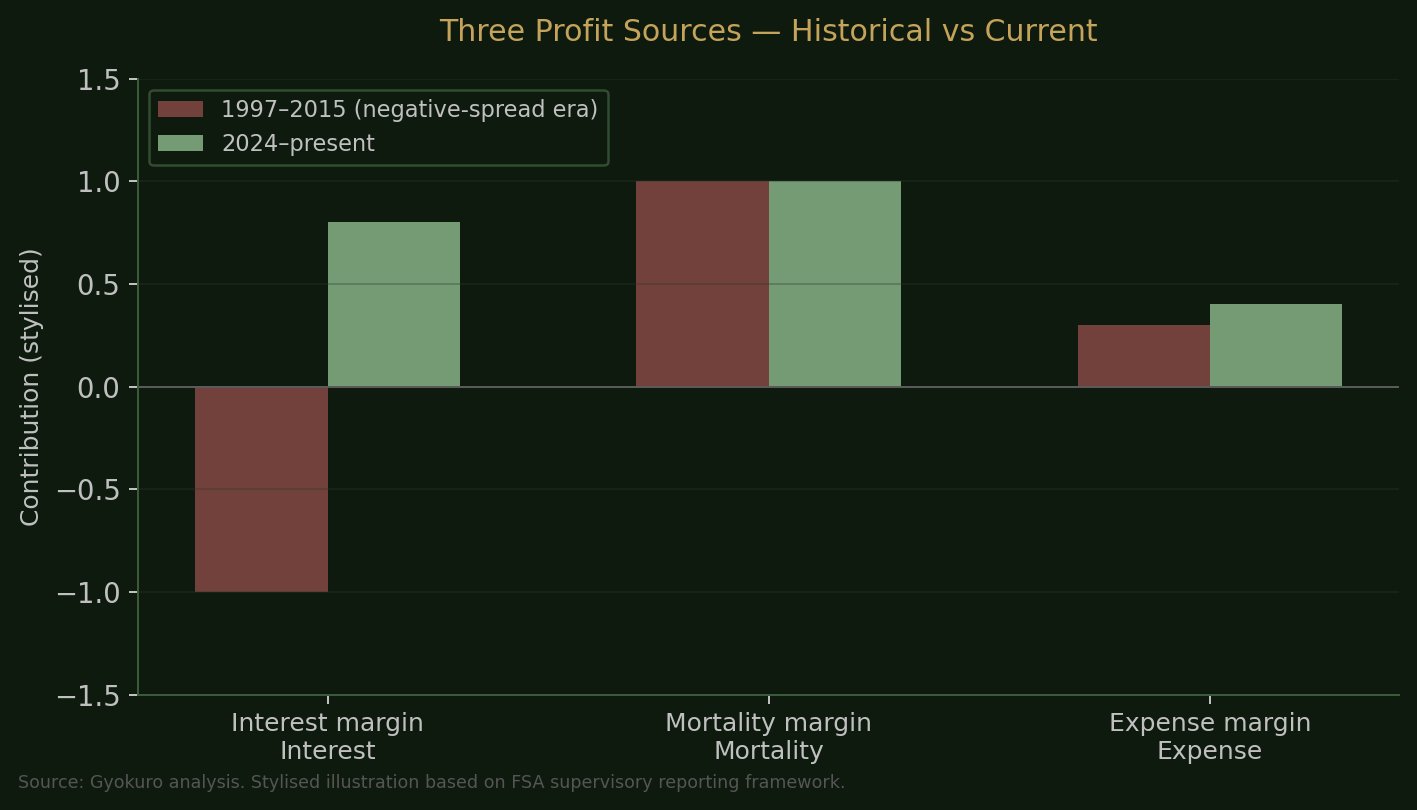
| Profit source | Japanese term | Mechanism | Recent trend |
|---|---|---|---|
| Interest margin | 利差益 (risa-eki) | Actual investment yield minus the assumed rate (予定利率) built into policy pricing, multiplied by reserves | Turning sharply positive after two decades of negative margins (逆ざや). Kampo reported ¥142.5bn positive margin for FY2024, up ¥50.7bn year-on-year |
| Mortality margin | 死差益 (shisa-eki) | Assumed mortality minus actual mortality—the gap between what the insurer expects to pay in claims and what it actually pays | Persistently large and positive. Conservative mortality tables and improving longevity produce a structural surplus |
| Expense margin | 費差益 (hisa-eki) | Assumed operating expenses minus actual expenses | Smaller contributor, but improving as digitalisation reduces per-policy costs |
For twenty years, the interest margin was deeply negative. Insurers had sold policies in the bubble era promising 5–6% guaranteed returns. When rates collapsed, actual investment yields fell far below those promises. This negative spread—known in the industry as gyakuzaya—destroyed seven life insurers between 1997 and 2001 and permanently scarred market sentiment toward the sector.
What kept the survivors alive was mortality margin. Japan’s life tables, published by the Institute of Actuaries of Japan, were updated infrequently and embedded thick safety buffers. Actual deaths consistently came in below assumptions, generating a reliable surplus that cross-subsidised the investment losses. This was not accidental. It was, functionally, the industry’s survival mechanism—tacitly understood by the FSA, which had every reason to prefer conservative mortality pricing over insurer insolvencies.
The market remembers that era vividly. That memory is precisely why these stocks remain cheap.
Why Japan’s life insurance business is structurally more profitable
The three-source framework is not merely an accounting curiosity. It reveals a profit architecture that has no direct parallel in Western markets—and that architecture is, on balance, significantly more favourable to insurers than the regimes governing their European and North American peers.
Before diving into the specifics, it helps to understand the big picture in intuitive terms.
Imagine two restaurant owners. One operates in a city where food prices are posted on a public comparison app, ingredient suppliers are constantly renegotiated, and customers switch freely between restaurants. The other operates in a quieter town where prices have been set by longstanding custom, suppliers are loyal, regulars rarely leave, and health inspectors visit infrequently and apply generous standards. Both serve good food. But the second owner’s margins are structurally fatter—not because he is a better cook, but because the environment in which he operates protects his profits in ways the first owner’s does not.
Japanese life insurers are the second restaurant owner. Their profit margins are wider than those of Western peers not primarily because of superior management, but because four features of their operating environment—the regulatory framework, the mortality-table system, the competitive landscape, and the reinsurance culture—combine to preserve margins that would be competed or regulated away in New York, London, or Frankfurt.
Consider what this means concretely. When a Japanese insurer prices a policy, it bakes in an assumed investment return (the yotei-riritsu, or assumed rate) and an assumed death rate. If the insurer actually earns more on its investments than assumed, it keeps the difference—that is the interest margin. If fewer policyholders die than assumed, it keeps that difference too—the mortality margin. In Western markets, competitive pressure and regulation work to keep both of these gaps narrow. In Japan, they are wide, and they stay wide, because the system changes slowly.
The interest gap is wide because the regulator’s benchmark rate adjusts with a lag—so when market rates rise, insurers enjoy an expanding spread for years before the benchmark catches up. In the US or Europe, this gap is either passed back to policyholders through adjustable dividends or eliminated in real time by market-consistent accounting rules.
The mortality gap is wide because Japan’s official life tables are conservative and updated infrequently. The tables assume more people will die than actually do, so insurers consistently pay out less in claims than they budgeted for. In the US and UK, tables are updated more often and set closer to actual experience, leaving less room for this kind of surplus.
On top of this, Japan’s insurance market is less competitive than Western markets—dominated by mutual companies that face no shareholder pressure to cut prices—and Japanese insurers retain more of their underwriting profit in-house rather than sharing it with reinsurers.
The net effect: Japanese life insurers earn profit from two sources simultaneously—investment spreads and mortality surpluses—at widths that do not exist in mature Western markets. As interest rates rise, the first source is expanding rapidly. The second has been reliably positive for decades and shows no sign of narrowing. This is the structural advantage that underpins the EV growth thesis.
With that framework in mind, here is the detailed mechanics of each advantage.
The interest-margin asymmetry. In the United States, the shift toward universal life and variable products from the 1980s onward transferred much of the investment risk to policyholders. Even traditional whole-life products use adjustable dividend scales, giving insurers a release valve when investment returns disappoint. In the United Kingdom, with-profits funds employed smoothing mechanisms and terminal bonus structures that achieved a similar effect. Under Solvency II in Europe, market-consistent valuation means reserves move with interest rates in near-real-time—the structural lag between assumed and actual yields that defines Japan’s 利差 simply does not arise in the same way.
Japan’s regulatory framework, by contrast, prescribed a 標準利率 (standard assumed interest rate) for reserve calculations that adjusted only slowly. When rates collapsed in the 1990s, this created the negative-spread trap. But the same mechanism now operates in reverse: as rates normalise, the gap between actual yields and legacy assumed rates widens in the insurer’s favour, and the regulatory machinery that once trapped them now locks in windfall margins. The transition from structural headwind to structural tailwind is more dramatic in Japan precisely because the system is stickier than its Western equivalents.
The mortality-margin gap. This is perhaps the most distinctive source of Japanese insurance profitability. In the US and UK, competitive pricing pressure, deep reinsurance markets, and frequently updated mortality tables compress mortality margins to relatively thin levels. The Commissioners Standard Ordinary (CSO) tables used by US state regulators are revised on a regular cycle and track actual experience more closely than their Japanese counterparts. European insurers under Solvency II must use best-estimate assumptions for mortality, with risk margins calculated separately—there is no regulatory incentive to embed large buffers in mortality pricing itself.
Japan’s 標準生命表 (Standard Life Tables), published by the Institute of Actuaries of Japan, have historically been updated infrequently and built in substantial conservatism. The result: Japanese insurers enjoy a mortality margin that is structurally wider and more persistent than anything available to their Western peers. This is not a market inefficiency waiting to be arbitraged away—it is embedded in the regulatory and actuarial infrastructure and changes only when the tables are formally revised.
The competitive-structure advantage. Japan’s domestic life-insurance market is dominated by mutual companies (相互会社)—Nippon Life, Meiji Yasuda, Sumitomo Life—that face no equity-market pressure to optimise pricing for shareholder returns. The listed players (Dai-ichi Life, T&D Holdings) compete against these mutuals, but the mutuals’ lack of shareholder scrutiny means pricing discipline across the industry remains relatively relaxed by international standards. In the US and UK, demutualisation waves in the 1990s forced greater transparency and price competition; Japan’s mutual-dominated structure has preserved wider margins industry-wide.
Furthermore, Japan’s distribution model—relying heavily on tied sales representatives (営業職員) and bancassurance rather than independent brokers or price-comparison platforms—limits the kind of commoditised price competition that has compressed margins in the UK and, increasingly, in parts of continental Europe.
The reinsurance differential. Western insurers make extensive use of reinsurance markets, which effectively outsource and compress mortality and morbidity margins. Japanese insurers have historically reinsured less, retaining a greater share of underwriting profit. Although the FSA has recently begun surveying life insurers’ reinsurance practices—particularly the growing trend of ceding reserves to Bermuda-based reinsurers backed by private-equity capital—the overall retention ratio remains higher than in mature Western markets.
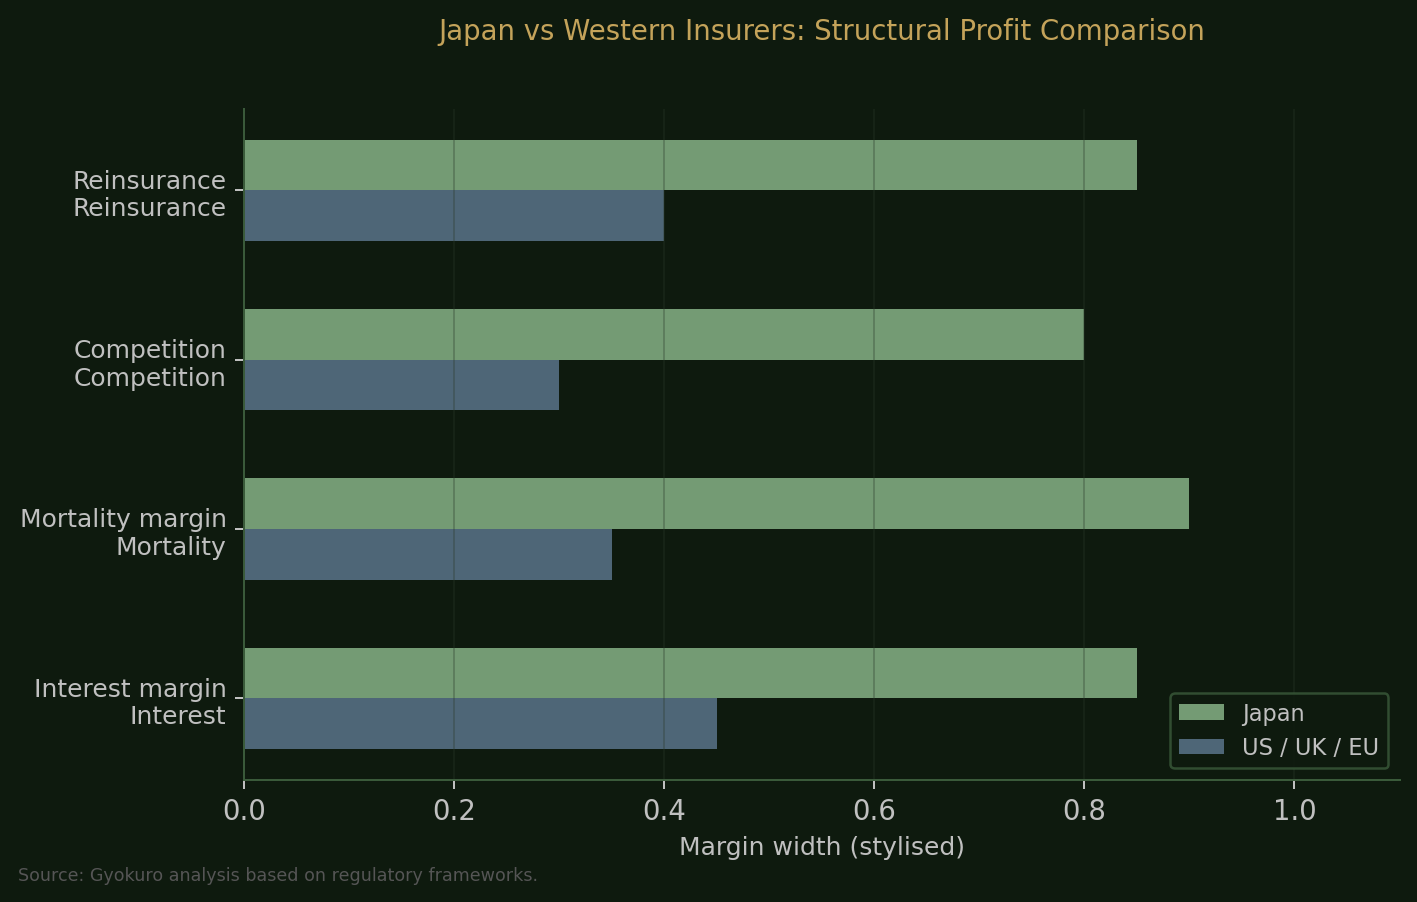
| Factor | Japan | US / UK / Europe |
|---|---|---|
| Interest-margin mechanism | Prescribed assumed rate, slow to adjust; currently producing widening positive spread | Adjustable (US dividend scales, UK with-profits smoothing) or market-consistent (Solvency II); spread is narrower and more volatile |
| Mortality-margin width | Wide and persistent; conservative tables updated infrequently | Narrow; tables updated regularly, deep reinsurance compresses margins |
| Competitive intensity | Mutual-dominated, limited price competition from tied distribution | Listed companies, independent brokers, price-comparison platforms drive margin compression |
| Reinsurance usage | Historically low; higher profit retention | Extensive; margin shared with reinsurers |
| Regulatory valuation | Transitioning from book-value to economic-value (2025–26); legacy system has preserved embedded margins | Market-consistent (Solvency II) or statutory/GAAP parallel; margins more transparent and arbitraged |
| Product guarantees | Legacy high-guarantee products now in run-off; new products at low assumed rates benefit disproportionately from rate rises | Fewer fixed guarantees (US shifted to variable/UL); less rate-sensitivity upside |
The cumulative effect is striking. Japanese life insurers are positioned to earn a combination of wide mortality margins and expanding interest-rate spreads—a dual profit engine that simply does not exist in mature Western markets. US Treasuries may offer competitive yields, but without the mortality-table conservatism embedded in Japanese regulatory assumptions, the combination of both margin sources simultaneously is uniquely Japanese. This is the structural advantage that foreign parent companies’ continued commitment to Japan tacitly acknowledges.
The current P/EV picture
Three life-insurance-focused companies trade on the Tokyo Stock Exchange. Their valuations, against disclosed Embedded Value, tell a striking story:
| Company | Ticker | Market cap | EV (as of 31 Mar 2025) | P/EV | PBR | Dividend yield |
|---|---|---|---|---|---|---|
| Dai-ichi Life HD | 8750 | ¥5.2tn | ¥8.17tn (EEV) | ~0.64x | 1.28x | ~3.5% |
| T&D Holdings | 8795 | ¥2.0tn | ~¥3.0tn+ (MCEV) | ~0.65x | ~1.0x | ~3.1% |
| Japan Post Insurance | 7181 | — | ¥3.94tn (EEV) | <1.0x | — | — |
Note: EV figures are from FY2024 (year ending 31 March 2025) company disclosures. Market capitalisation and PBR as of early March 2026. EV methodologies differ between companies (EEV vs MCEV vs new economic-value-based standards being adopted for Solvency II alignment). European listed insurers typically trade at 0.8–1.2x EV.
At 0.6–0.7x, the market is saying one of two things: either it expects EV to shrink—that the present value of in-force business will deteriorate—or it simply does not understand the metric. For reasons that follow, the former explanation is difficult to sustain.
Where could P/EV go? A peer-benchmarked re-rating framework
The discount at which Japanese life insurers trade is not merely a domestic curiosity. It becomes genuinely striking when placed alongside international peers operating in comparable or less favourable environments.
| Peer group | Representative companies | Typical P/EV range | Key characteristics |
|---|---|---|---|
| Japanese listed life | Dai-ichi Life, T&D HD, Kampo | 0.6–0.7x | Dual-margin advantage (interest + mortality), rising-rate tailwind, but legacy negative-spread memory depresses multiples |
| European mature life | Allianz (life), Generali, Legal & General, NN Group | 0.8–1.0x | Solvency II transparency, moderate growth, strong capital returns; market-consistent valuation removes embedded margin opacity |
| North American life | Manulife, Sun Life, MetLife, Prudential Financial (US) | 0.7–1.0x | Variable/UL product shift reduces rate sensitivity; diversified into asset management; deep reinsurance compresses underwriting margins |
| Asian growth life | AIA Group, Prudential plc (Asia) | 1.0–1.5x | High new-business growth in underpenetrated markets; strong ROEV; premium valuation reflects demographic growth runway |
Note: P/EV ranges are indicative and based on market observations and company disclosures as of mid-2025 to early 2026. Actual multiples fluctuate with market conditions. Not all companies disclose EV on a comparable basis; some ranges are estimated from analyst consensus.
Several observations emerge from this comparison.
First, Japanese life insurers trade at the bottom of the global range, below even the most mature, slow-growth European peers. This is difficult to justify on fundamentals alone. European life insurers under Solvency II face margin compression from market-consistent valuation and thin mortality margins—yet the market values them at 0.8–1.0x EV. Japanese insurers, with wider mortality margins, an expanding interest-rate spread, and a regulatory regime that preserves embedded profitability, trade at 0.6–0.7x. The discount implies that the market views Japan’s structural advantages as worth less than nothing compared to European norms.
Second, the re-rating pathway does not require Japanese insurers to be valued like high-growth Asian peers at 1.0–1.5x. It merely requires convergence toward the European range of 0.8–1.0x—a peer group with arguably worse structural economics. That convergence alone would imply 15–50% upside from current levels, before any EV growth.
What drives P/EV multiple expansion? Four factors determine where an insurer trades within the P/EV spectrum:
Return on Embedded Value (ROEV): The higher the return the insurer generates on its existing EV, the more the market is willing to pay per unit of EV. Dai-ichi Life reported a modified ROE of 10.7% in FY2024, which is now competitive with European peers. T&D Holdings achieved an ROEV of 5.2% (four-year average: 7.9%). As rate normalisation lifts interest margins, ROEV should continue improving—pulling multiples higher.
EV growth expectations: Markets pay premium multiples for insurers whose EV is expected to grow. As this article will argue below, both ANW and VIF components are set to expand. The shift from “EV is stagnant or shrinking” (the legacy narrative) to “EV is growing structurally” (the emerging reality) is precisely the kind of perception shift that drives re-rating.
Risk profile and EV volatility: Insurers with less volatile EV command higher multiples. Japan’s ongoing shift from equity-heavy balance sheets to duration-matched bond portfolios, combined with the strategic shareholding unwind, is reducing EV volatility—another multiple-expanding force. The FSA’s introduction of economic-value-based solvency regulation in 2025–26, aligned with Solvency II and the IAIS Insurance Capital Standard, will improve transparency and comparability, potentially removing the “opacity discount” that has weighed on Japanese multiples.
Shareholder returns and capital discipline: Aggressive buybacks and rising dividends signal management confidence in sustainable EV generation. Dai-ichi’s ¥100 billion buyback and T&D’s ¥100 billion programme, funded by strategic shareholding sales, are exactly the capital-return behaviour that the market rewards with multiple expansion.
A scenario framework for P/EV re-rating:
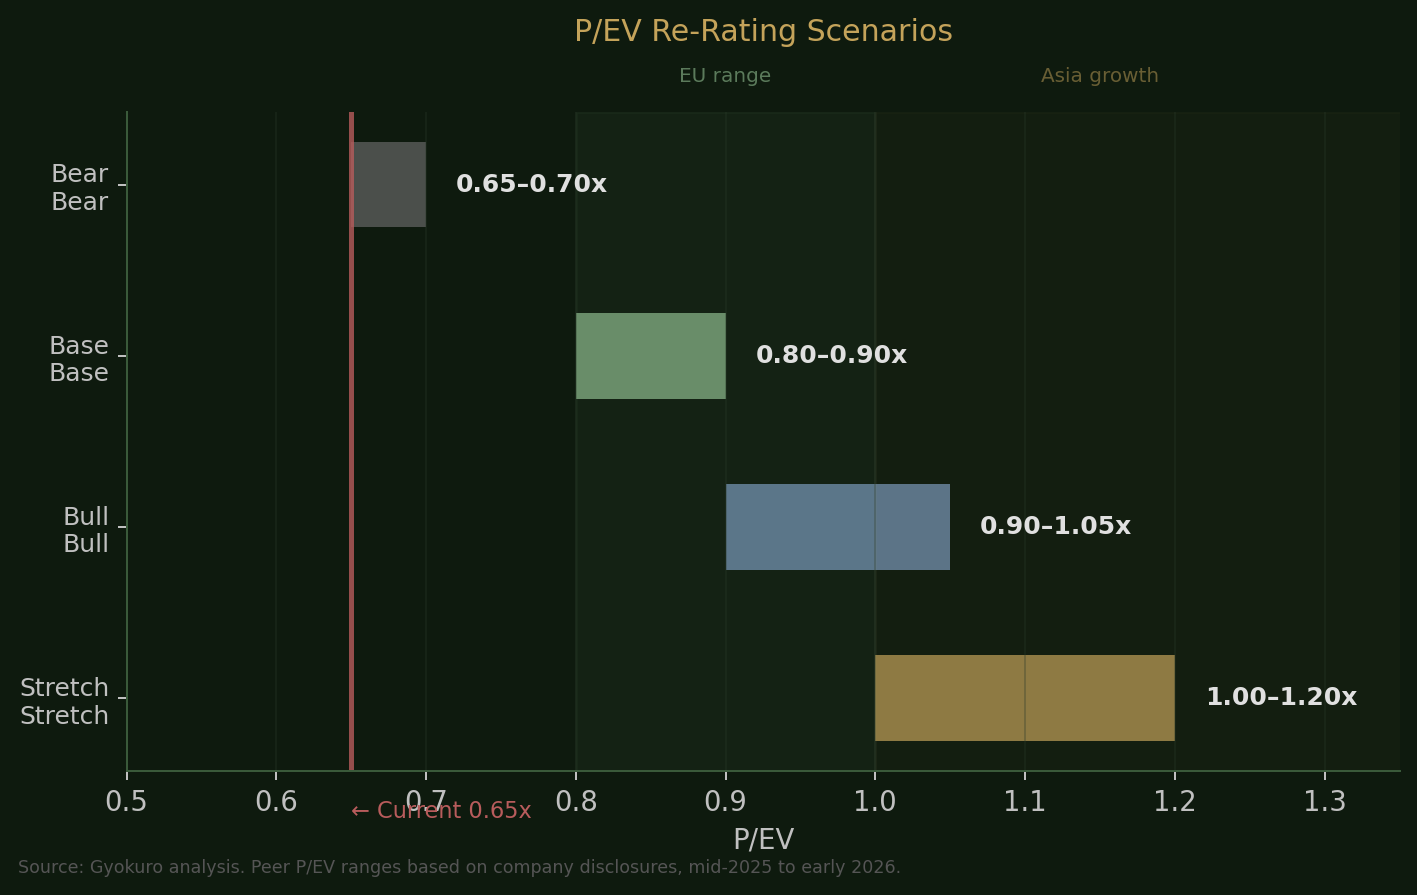
| Scenario | P/EV target | Implied upside (from 0.65x) | Conditions |
|---|---|---|---|
| Bear case (negative-spread memory persists) | 0.65–0.70x | 0–8% | Rates stall; market continues to price in historical risk; no catalyst |
| Base case (gradual convergence to EU norms) | 0.80–0.90x | 23–38% | BOJ continues normalisation; ROEV improves to 8–10%; new solvency regime improves transparency |
| Bull case (full re-rating on dual-margin thesis) | 0.90–1.05x | 38–62% | Terminal rate rises above 1.5%; market recognises dual profit engine; ROEV exceeds 10%; P/EV converges with European upper range |
| Stretch case (Asian-growth premium) | 1.0–1.2x | 54–85% | Third-sector / nursing-care products drive new-business growth comparable to Asian peers; foreign investor inflows accelerate |
The critical insight is that P/EV re-rating and EV growth are not mutually exclusive—they compound. If EV grows by 10% while the multiple expands from 0.65x to 0.85x, the resulting share-price appreciation is not 10% plus 31%—it is 10% × 1.31, or roughly 44%. This compounding of EV growth and multiple expansion is the mechanism through which structurally undervalued insurers deliver outsized equity returns.
Dai-ichi Life’s own IR materials make this point explicitly. In its medium-term plan presentations, the company decomposed its market capitalisation target into the product of “profit × PER” and “EV × P/EV multiple”, benchmarking both against a peer set of five domestic insurers and five overseas groups including AXA, Manulife, MetLife, and Prudential Financial. The company’s stated objective of reaching “global top-tier” market capitalisation rests on improving both the numerator (EV growth) and the multiplier (P/EV convergence toward international norms). Management, in other words, has explicitly identified the re-rating thesis as corporate strategy.
It is worth pausing on the base case to appreciate its modesty. Japanese life insurers do not need to be valued like high-growth Asian peers at 1.0–1.5x EV—the territory of AIA Group or Prudential plc’s Asia business, where underpenetrated demographics justify premium multiples. All that is required is convergence toward the European mature range of 0.8–1.0x: a peer group comprising slow-growth, margin-compressed insurers operating under Solvency II in ageing Western European economies. As argued above, European insurers have objectively worse structural economics than their Japanese counterparts—thinner mortality margins, narrower interest spreads, more competitive markets, and heavier reinsurance usage. Yet they command higher multiples. Closing this gap alone implies 15–50% share-price upside from current levels, entirely from multiple expansion, before a single yen of EV growth is accounted for.
This is the floor, not the ceiling.
Several forces could push P/EV multiples beyond the base case—not through hype, but through measurable shifts in capital allocation and investor behaviour.
Capital return intensity that outpaces the market. Japanese life insurers are now returning capital to shareholders at a rate that rivals or exceeds the banking sector—the very sector that has captured most of the “rising rates” narrative. T&D Holdings achieved a total shareholder return ratio (dividends plus buybacks as a share of profits) of 100% in FY2024, funded by the record ¥100 billion buyback programme. Dai-ichi Life raised its dividend payout ratio from 30% to 45% and executed its own ¥100 billion buyback, with both companies indicating that the proceeds from strategic shareholding sales will continue to fund returns over multiple years. For context, Japan’s mega-banks—the supposed stars of the rate-normalisation trade—have payout ratios in the 30–40% range, with total shareholder return ratios well below 100%.
This comparison matters. When an insurer returns more capital per unit of market capitalisation than a bank, while simultaneously enjoying a lower valuation multiple and a structurally superior margin profile, the mispricing becomes difficult for systematic investors to ignore. Capital-return screens—which drive a growing share of quantitative and factor-based allocations—will mechanically flag these stocks as the return data accumulates.
Yen appreciation and the foreign flow channel. If Japan’s terminal rate continues to rise while the Fed’s rate trajectory trends lower—a scenario consistent with the BOJ’s normalisation path and the political dynamics around the next Fed chair—the yen is likely to strengthen structurally. For foreign investors, yen appreciation adds a currency return on top of any equity return, making yen-denominated assets incrementally more attractive.
Life insurers are particularly well-positioned to capture this flow. They are domestic-demand businesses largely insulated from trade-war risks that affect exporters. They benefit from the same rate-normalisation thesis that drives the yen higher. And their high dividend yields provide income that compounds in a strengthening-yen environment.
Foreign investors are structurally underweight. The conditions for a flow-driven re-rating exist precisely because institutional money has not yet arrived. According to GMO’s research, the average international equity mutual fund is 6.9% underweight Japan relative to the MSCI EAFE benchmark. Within Japan, insurance stocks receive disproportionately little foreign attention compared with banks, trading companies, and technology—the sectors that dominated the 2023–24 foreign inflow wave. The insurance sector’s analytical complexity (EV-based valuation, three-source profit decomposition, mutual-vs-listed distinctions) creates a natural barrier to entry that has kept generalist foreign investors on the sidelines.
This is not a permanent condition. The catalysts for closing the gap are identifiable: the new economic-value-based solvency regime (2025–26) will produce disclosures directly comparable to Solvency II, removing the “Japanese accounting opacity” objection; rising capital returns will show up in screening tools; and sell-side coverage of the P/EV thesis is likely to expand as the rate-normalisation trade matures beyond banks. The Hennessy Japan Fund, which holds all three major non-life insurance groups, has already described Japanese insurers as “growth in disguise” stocks—companies with compelling growth prospects disguised by valuations that appear cheap. The same logic applies with even greater force to life insurers, where the EV framework makes the disguise measurable.
The scenario in which foreign institutional allocation to Japanese insurance stocks normalises—even partially—while the yen appreciates and capital returns accelerate, is not the base case. But neither is it speculative. It is the logical consequence of trends already in motion, and it would push P/EV multiples comfortably into the 0.9–1.1x range, generating total returns (multiple expansion plus EV growth plus currency gains) that would be difficult to replicate elsewhere in developed-market equities.
Will EV grow? The macro case (ANW and VIF)
ANW: balance-sheet forces
Three dynamics are acting on adjusted net worth simultaneously.
Rising yields boost income. New money invested in JGBs and corporate bonds earns materially more than it did even two years ago. The 30-year JGB yield has climbed above 2.5%, a level not seen in over a decade. For insurers reinvesting maturing bonds from the zero-rate era, the income uplift compounds with each roll.
Mark-to-market losses on existing JGBs look alarming but are largely illusory. Nippon Life disclosed ¥3.6 trillion in unrealised losses on its bond portfolio for FY2024. Meiji Yasuda reported ¥1.4 trillion. These are real numbers—but for buy-and-hold insurers with liability-matched portfolios, they reverse mechanically as bonds approach maturity. The loss is accounting noise, not economic reality. The reader who understands duration matching will dismiss these headlines; the reader who does not will be frightened away—creating the valuation gap.
Strategic shareholding unwinds crystallise decades of latent value. TSE governance reform is forcing insurers to sell cross-held equities. Dai-ichi Life has been reducing its domestic equity book systematically, using proceeds to fund a ¥100 billion share buyback programme. T&D Holdings announced its own record ¥100 billion buyback. These are not one-off events; the regulatory pressure to reduce policy shareholdings is structural and multi-year.
VIF: the future earnings engine
This is where the thesis sharpens. VIF grows when: (a) the spread between actual investment returns and assumed rates widens; (b) new business adds profitable policies to the in-force book; and (c) mortality and expense experience remain favourable.
Rate normalisation is the primary driver. Every basis point of additional yield above the assumed rate flows directly into VIF through the interest-margin channel. Kampo’s disclosure is illustrative: a 30-basis-point spread between actual and assumed rates generated ¥142.5 billion in positive margin in a single year. If the BOJ continues to normalise—and the trajectory of wage growth, inflation persistence, and fiscal dynamics all suggest it will—the spread widens further.
A sensitivity illustration makes the point concrete:
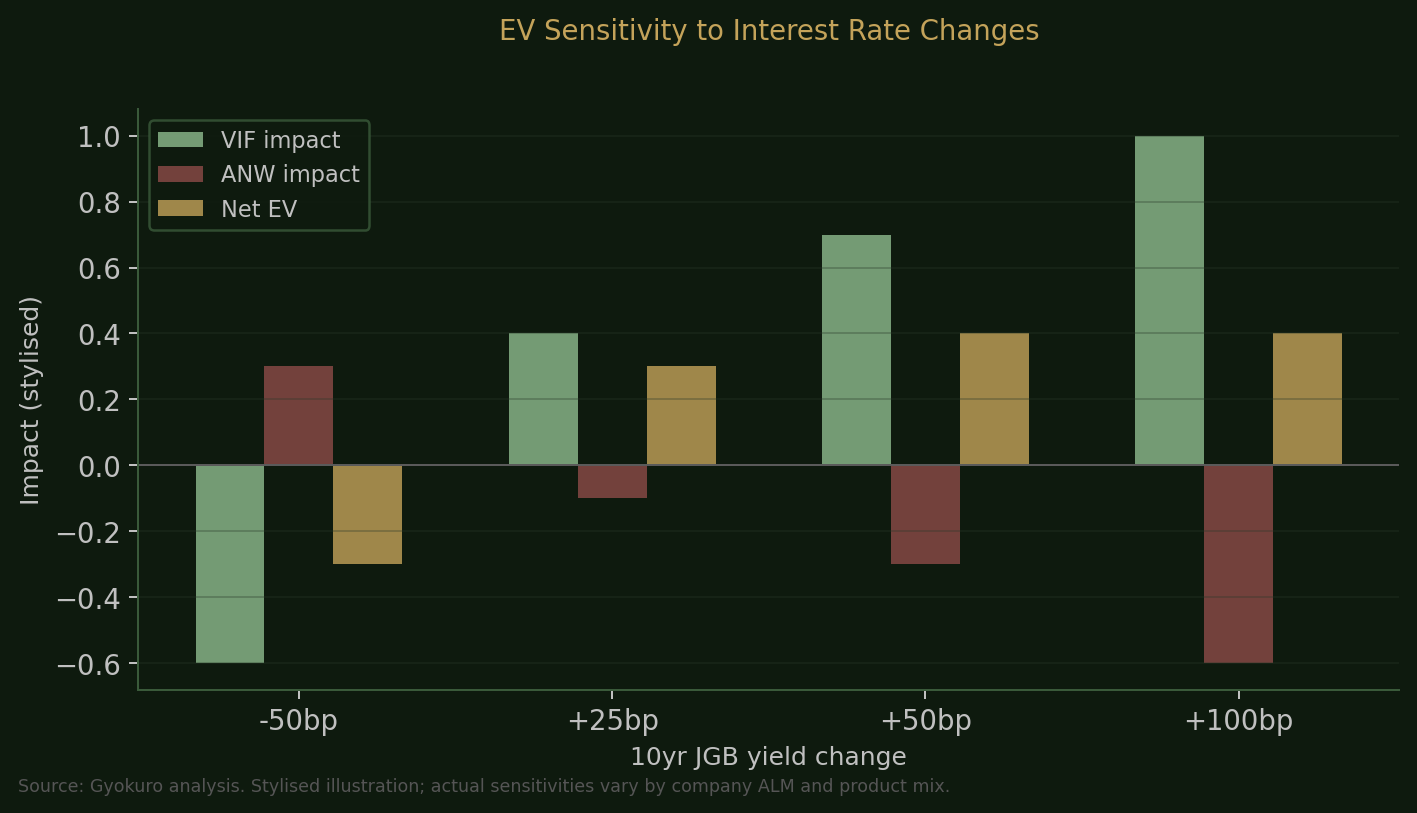
| Scenario | Impact on VIF | Mechanism |
|---|---|---|
| JGB 10yr +25bp | Moderately positive | Wider earned spread outweighs higher discount rate for legacy books with low assumed rates |
| JGB 10yr +50bp | Significantly positive | Same mechanism, larger magnitude; interest-margin expansion accelerates |
| JGB 10yr +100bp | Strongly positive (with caveat) | Major VIF uplift, but unrealised losses on existing bond holdings temporarily depress ANW. Net EV still rises for well-managed ALM books |
| JGB 10yr −50bp | Negative | Spread compression; risk of returning to negative spreads for highest-guarantee legacy blocks |
Note: Actual sensitivities vary by company based on asset-liability duration matching, product mix, and hedging strategies. Dai-ichi Life and T&D both disclose formal EV sensitivity tables in their annual reports.
New business value is accelerating. Dai-ichi Life’s group new business value surged 62% year-on-year to ¥172.4 billion in FY2024. T&D reported increases driven by Daido Life’s expanding corporate client base and domestic rate rises. Every yen of new business value is incremental VIF.
Will EV grow? The micro case (ageing society)
The conventional narrative runs as follows: Japan’s population is shrinking; fewer people means fewer policyholders; the insurance market must contract. This is wrong—or at best, a half-truth that obscures a more interesting structural shift.
| Segment | Traditional view | Structural reality |
|---|---|---|
| Death protection (死亡保障) | Declining demand as household size shrinks and inheritance needs diminish | True for simple term life. But whole-life products are being repositioned as estate-planning and tax-optimisation tools for wealthy elderly |
| Medical / cancer (医療・がん) | Mature market, limited growth | Demand increases with age. Per-capita medical insurance spend rises sharply after 60. Third-sector products now dominate new business at most major insurers |
| Nursing care / dementia (介護・認知症) | Niche product | Becoming mainstream. Public long-term care insurance (介護保険) is under fiscal strain; private supplementary coverage is a policy imperative, not just a product opportunity |
| Annuities / retirement income | Low-rate era suppressed demand | Rising rates make guaranteed-income products viable again. Bancassurance channels (Dai-ichi Frontier Life, Japan Post) are seeing surging demand from retirees with 新NISA-accumulated assets |
Longevity compounds the mortality margin. This is the most counterintuitive point. As the population ages, one might expect mortality costs to rise. But life expectancy continues to extend—meaning actual mortality undershoots assumed mortality by a wider margin each year. The mortality surplus that sustained the industry through two decades of negative investment spreads is not eroding; it is compounding.
Premium per policyholder is rising. Even as headcount declines, the average revenue per customer is increasing because the product mix is shifting toward higher-margin third-sector coverage. The industry’s top line may grow slowly, but the quality of earnings is improving.
What the foreign parents already know
One final observation. Prudential Financial, MetLife, Aflac, and other foreign insurers maintain substantial Japanese operations despite repeated compliance frictions and a regulatory environment that demands heavy local investment. The orthodox response to subsidiary misconduct at a US-headquartered insurer is structural intervention—leadership overhauls, business-line reviews, potential retreat. In Japan, the response has been notably more surgical: discipline individuals, tighten procedures, preserve the franchise.
The simplest explanation is the most revealing. The economics are too attractive to disrupt. A market that generates both a structural mortality surplus and a widening interest-rate spread, inside a regulatory framework that changes slowly, is not something a rational multinational walks away from. When the parent company’s behaviour tells you more than any sell-side report, it is worth paying attention.
This article reflects my own reading of publicly available information and is not investment advice.
— Gyokuro